Per-user Reports
In addition to the amount of downloads each authenticated user consumes, LiveStream 5 also records the specific content they access, down to each URL, the application they used, the category of the URL, the device they used etc.
All of this data can be accessed and filtered on a per-user basis from their profile page, allowing administrators to see exactly what a user was accessing and how during a specified time period.
To start reporting on a the activity of a user, from their profile page, click the Reports button under their username, on the left of the screen.
Per-user reports can be viewed in one of two modes:
Summary mode — breaks down the activity by categories and domains to give a high-level overview for the time period.
Forensic mode — shows each individual URL that the user requested during the time period.
When you open a user's reports for the first time the time period will default to the current date e.g. it will show just today's usage until you customise it.
We recommend reading about what constitutes a request and a URL in the List Group entries section before continuing
Summary mode
Summary mode is selected by default when you first open the reports for a user. This provides a basic overview of the user's activity grouped by categories and domains (websites) and sorted by highest number of requests.
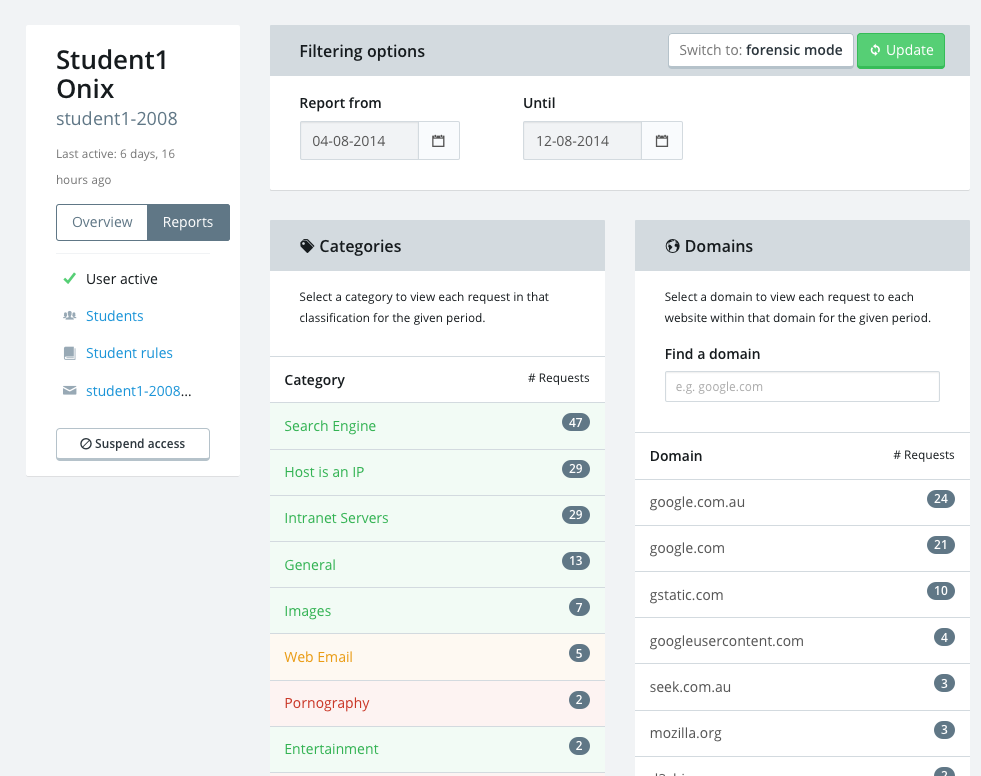
Select your time period using the report from and until date fields.
The results will automatically update to reflect your chosen time period.
You will be presented with lists of the website categories and domains that are were requested the most by this user during specified time period.
ProTip: You can quickly find any domain that a user accessed using the find a domain field, regardless of how high it is in the list.
If you wish to drill down to view the the specific URLs that were requested within a category or domain, select from the list and the system will generate a new forensic report for you using your chose time period and filtered by the category or domain you selected.
Forensic mode
As exemplified below, you will typically enter forensic mode by by drilling down from summary mode which will pre-populate your filtering options. However, you may also skip directly into forensic mode and customise the filters directly.
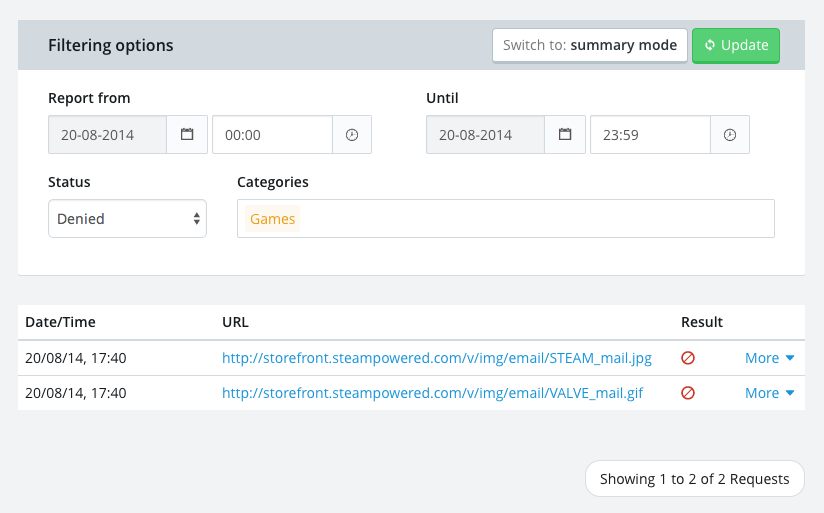
When generating forensic reporting data there a number of controls to choose from:
From and Until times can be edited to an accuracy of one minute via the keyboard using a
hh:mmformat. These time inputs use a twenty-four hour clock.Status filters the requests by their result e.g. whether the request was allowed or denied. By default all results will be included.
The (optional) categories field allows you to filter the results for just the specific website categories you are interested in. LiveStream will auto-suggest categories as you type, press enter to select one or more.
Click the reload button to apply your filtering options and load the latest data.
Forensic details
Within forensic mode all the results are displayed by the date and time, URL, result (allowed or denied). Even more details can be revealed about a request by clicking the more link.
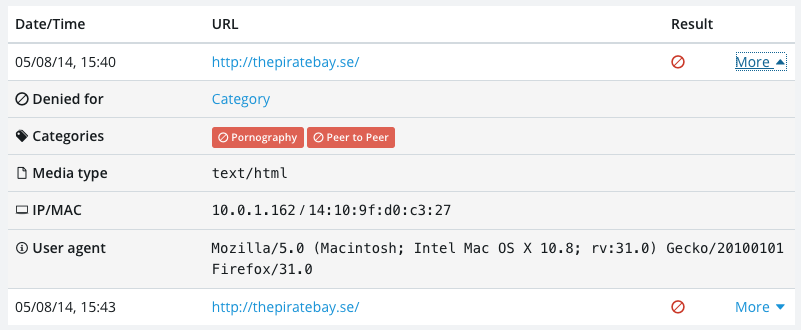
These additional forensic details include:
Denied for — only displayed if the request was denied. The value will link to the Policy Set rule that was responsible for the denial, in case you wish to change it.
Categories — each category that the URL was classified as. If a category resulted in the request's denial it will contain a banned icon (pictured above).
Media type — The type of file requested e.g. image, text, video, audio etc.
IP/MAC — The IP and MAC address of the network interface where the request originated. The MAC address, where available, should be unique to the hardware of the specific device that made the request.
User agent — identifies the browser or application from which the request was made as well as the operating system environment. This can be useful for diagnosing unexpected behaviours experienced by users.
A clear domain filter action is available if you are filtering by domain.